Fisheries | Research
Fisheries DTO
Digital twin of fisheries
A series of scripts and an Shiny app in R have been developed and will be used for online ecosystem assessment through a series of fisheries and community indicators.
Fisheries (landings from official data sources such as ICES and FAO but also catch data from Sea Arouns Us database), biological (thermal preferences, trophic levels, and resilience of species/stocks as they are available in FishBase and SeaLifeBase) and environmental ( sea surface temperature and Chlorophyll or primary production) data that are available at ecosystem or ecoregion level can be used in every pilot area regardless if the pilot is dedicated to fisheries or not. This approach can be used in any ecosystem of the world provided that the baseline data area available.
Mean Temperature of the Catch (MTC), one of the community indicators of the Shiny R App is able to "predict" future changes in marine communities and fisheries catch with sea warming and the proportional contribution (or increase) of alien species in a marine ecosystem or the fisheries catch.
Based on the fisheries (landings data from official sources such as the FAO/ICES/GFCM datasets and catch data from the Sea Around Us project), biological (thermal preferences, trophic levels and resilience of marine species) and environmental (Sea Surface Temperature and Chlorophyll/primary production) datasets, the objective of fisheries modelling was to set up a series of models/indicators that will be used to assess ecosystem and fisheries status. These indicators have been used to create a DTO Fisheries Shiny App for assessing fisheries and ecosystem status, while one of them can be used even for predicting alien species expansion and population outbursts of species benefited by sea warming. All these indicators can be applied to catch/landings data but also on survey data (CPUE, abundance, biomass), which is available for the NE Atlantic areas though ICES databases.
The following indicators can be used to assess the effect of fishing on communities and ecosystems (mTLc, FiB, FSI, ResIndex, Ryther, Fogarty, Friedland) and the effect of climate change/sea warming on marine communities/ecosystems (MTC). The ILIAD DTO Fisheries Shiny App can be used for the online assessment of fisheries stocks and some ecosystem/community indicators that will "predict" changes in fisheries catch with sea warming or the proportional increase of alien/invasive species.
Although aimed to be applied on fisheries pilots (North Sea and Black Sea), the Shiny Apps that are being developed for assessing ecosystem status using indicators and assessments can be applied on various spatial resolution levels depending on data availability. Hence, they can be applied to all areas/pilots, to statistical fishing areas/divisions, to marine ecoregions, to large marine ecosystems and at a country level.
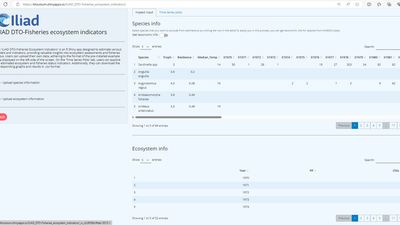
Community/Ecosystem indicators
Mean Weighted Trophic Level of the Catch (mTLc)
Theory
The mean weighted trophic level of the catch (mTLc) that has been used to assess the effect of fisheries on marine ecosystems and calculated based on the mean trophic level of an area/fleet/ecosystem weighted by the catch of each species contributing to the total catch (Pauly et al. 1998); see also Dimarchopoulou et al. (2021) for a recent application in the Mediterranean Sea). It can be estimated per fleet, ecosystem or fishing subarea based on catch/landings or survey data.
Data requirements
- List of all species participating in the catch\landings or survey
- Trophic level per species (from FishBase for fishes and SeaLifeBase for invertebrates)
- Catch/landings or fisheries independent estimated biomass (monthly or annual values)
Output
A time series with mTLc values (monthly or annual depending on the catch/landings or survey data availability) and a potential correlation with fishing effort for predicting future mTLc variability.
----------------
Fishing in Balance index (FiB)
Theory
The Fishing in Balance index (FiB), which complements the mTLc analysis is an indicator of exploitation and geographic/bathymetric expansion or contraction of fisheries. The FiB index attains a value of 0 for the first year of the series and does not vary in periods in which the mTLc and catch change in opposite directions, unless the effect of catch (or mTLc) is very strong. When the trends of both the catch and the mTLc are increasing (or declining), then the increase (or decline) in the FiB index is stronger. Increasing or decreasing FiB values indicate a geographic expansion or con-traction—or collapse—of the fishery in question, respectively (Pauly et al. 2000). Negative and declining FiB values are indicative of overexploitation. It can be estimated per fleet, ecosystem or fishing subarea based on catch/landings or survey data.
Data requirements
- List of all species participating in the catch\landings or survey
- Trophic level per species (from FishBase for fishes and SeaLifeBase for invertebrates)
- Catch/landings or fisheries independent estimated biomass (monthly or annual values)
Output
A time series with FiB values (monthly or annual depending on the catch/landings or survey data availability) and a correlation with fishing effort for predicting future trends.
-----------------
Fishing Sustainability Index (FSI)
Theory
Fishing Sustainability Index (FSI) uses a factor to correct the magnitude of difference of MWTL and FiB to the first year of the time series and expresses this difference in standard deviation units so that the ordinate scale indicates change without reference to absolute trophic levels (Kleisner & Pauly 2011)
Data requirements
- List of all species participating in the catch\landings or survey
- Trophic level per species (from FishBase for fishes and SeaLifeBase for invertebrates)
- Catch/landings or fisheries independent estimated biomass (monthly or annual values)
- Additional statistical analysis
Output
A corrected time series with FSI values (monthly or annual depending on the catch/landings or survey data availability) and a correlation with fishing effort for predicting future FSI trends.
-----------------
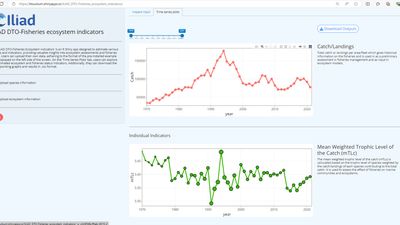
Catch/landings time-series
Theory
Total catch or landings per area/fleet which gives historical information on the fisheries and is used in as a preliminary assessment in fisheries management and as input in ecosystem models.
Data requirements
- List of all species participating in the catch
- Catch/landings (monthly or annual values)
Output
A time series of catch/landings (monthly or annual values) with an indication of the status of fishery based on the year of the catch and its percentage compared to the historical maximum catch value (catch-based method).
-----------------
Resilience Index (ResIndex)
Theory
The Resilience Index (Res Index) is calculated based on the maximum intrinsic population increase (resilience) of species weighted by the catch/landings of each species contributing to the total catch (Tsikliras & Touloumis unpublished). It is used to assess the effect of fisheries on marine communities and ecosystems.
Data requirements
- List of all species participating in the catch\landings or survey
- Resilience per species (from FishBase for fishes and SeaLifeBase for invertebrates)
- Catch/landings or fisheries independent estimated biomass (monthly or annual values)
Output
A time series with mean weighted resilience values (monthly or annual depending on the catch/landings or survey data availability) and a correlation with fishing effort for predicting future trends.
-----------------
Ryther
Theory
Ryther index expresses the catch/landings per area (in km2). It can be used for comparing the catch/landings among areas of different size (Link & Watson 2019).
Data requirements
- List of all species participating in the catch\landings or survey
- Catch/landings (monthly or annual values)
- An estimation of the area the fishery operates (in km2)
Output
A time series of catch/landings (monthly or annual values) per km2 with an indication of the status of fishery based on the year of the catch and its percentage compared to the historical maximum catch value (catch-based method).
-----------------
Fogarty
Theory
Fogarty index expresses the catch/landings per unit of primary production (Link & Watson 2019). It can be used for comparing the catch/landings among areas based on the productivity of each area.
Data requirements
- List of species all species participating in the catch
- Catch/landings or fisheries independent estimated biomass (monthly or annual values)
- Time-series of primary production at the same temporal scale (monthly or annual values)
Output
A time series of catch/landings (monthly or annual values) per unit of primary production.
-----------------
Friedland
Theory
Friedland index expresses the catch/landings per unit of chlorophyll-a based on the productivity of each area (Link & Watson 2019). It can be used for comparing the catch/landings among areas based on the productivity of each area.
Data requirements
- List of species all species participating in the catch
- Catch/landings or fisheries independent estimated biomass (monthly or annual values)
- Time-series of chlorophyll-a at the same temporal scale (monthly or annual values)
Output
A time series of catch/landings (monthly or annual values) per unit of chlorophyll-a.
-----------------
Mean Temperature of the Catch (MTC)
Theory
The mean temperature of the catch (MTC) is an index that has been recently proposed for the evaluation of the effect of sea temperature increase on marine fisheries catches based on the preferred temperature range of the species participating in the catches as it emerges from each species’ global distribution (Cheung et al. 2013; see also Tsikliras & Stergiou (2014) for an application in the warming Mediterranean Sea). MTC can be estimated per fleet, ecosystem or fishing subarea.
Data requirements
- List of all species participating in the catch\landings or survey
- Temperature preference of each species (from FishBase/SeaLifeBase or Cheung et al., 2013; preferably from both)
- Catch/landings or fisheries independent estimated biomass/abundance/CPUE from survey data (monthly or annual values)
Output
A time series with annual MTC values (monthly or annual values depending on the catch/landings/biomass data availability) and a correlation with SST for predicting future catch composition.
REFERENCES
- Cheung WWL, Watson R, Pauly D (2013) Signature of ocean warming in global fisheries catch. Nature 497: 365−368
- Dimarchopoulou D, Tsagarakis K, Keramidas I, Tsikliras AC (2019) Ecosystem models and effort simulations of an untrawled gulf in the central Aegean Sea. Frontiers in Marine Science 6: 648.
- Dimarchopoulou D, Keramidas I, Sylaios G, Tsikliras AC (2021) Eco-trophic effects of fishing across the Mediterranean Sea. Water 13: 482
- Froese R, Winker H, Coro G, Demirel N, Tsikliras AC, Dimarchopoulou D, Scarcella G, Quaas M, Matz-Lück N (2018) Status and rebuilding of European fisheries. Marine Policy 93: 159–170.
- Froese R, Winker H, Coro G, Demirel N, Tsikliras AC, Dimarchopoulou D, Scarcella G, Palomares MLD, Dureuil M, Pauly D (2020) Estimating stock status from relative abundance and resilience. ICES Journal of Marine Science 77: 527-538
- Froese R, Winker H, Coro GP, Palomares MLD, Tsikliras AC, Dimarchopoulou D, Touloumis K, Demirel N, Vianna GMS, Scarcella G, Schijns R, Liang C, Pauly D (2023) New developments in the analysis of catch time series as the basis for fish stock assessments: The CMSY++ method. Acta Ichthyologica et Piscatoria 53: 173–189
- Kleisner K, Pauly D (2011) The Marine Trophic Index (MTI), the Fishing in Balance (FiB) Index and the spatial expansion of fisheries. Fisheries Centre research reports 19 (3): 41-44
- Link JS, Watson RA (2019) Global ecosystem overfishing: Clear delineation within real limits to production. Science Advances 5: eaav0474.
- Pauly D, Christensen V, Dalsgaard J, Froese R, Torres F (1998) Fishing down marine food webs. Science, 279: 860–863
- Pauly D, Christensen V, Walters C (2000) Ecopath, Ecosim and Ecospace as tools for evaluating ecosystem impact of fisheries. ICES Journal of Marine Science 57: 697–706.
- Tsikliras AC, Stergiou KI (2014) Mean temperature of the catch increases quickly in the Mediterranean Sea. Marine Ecology Progress Series 515: 281-284
- Tsikliras AC, Touloumis K, Pardalou A, Adamidou A, Keramidas I, Orfanidis G, Dimarchopoulou D, Koutrakis M (2021) Status of 74 non-commercial fish and invertebrate stocks in the Aegean Sea using abundance and resilience. Frontiers in Marine Science 7: 578601
Additional Details
Type: Web Applications
Theme: Fisheries, Research, Environment, Blue Economy, Iliad: Pilots
Iliad Project Component
Dataset sources: FishBase, SeaLifeBase, ICES, FAO, GFCM, Sea Around Us, NOAA, EmodNet, EcoScope Platform
Language(s): English
Contact Information:
Athanassios Tsikliras
Professor
Aristotle University of Thessaloniki
Screenshots
Feedback
Have you used this product? Please provide feedback to help product owners improve the quality of their products.